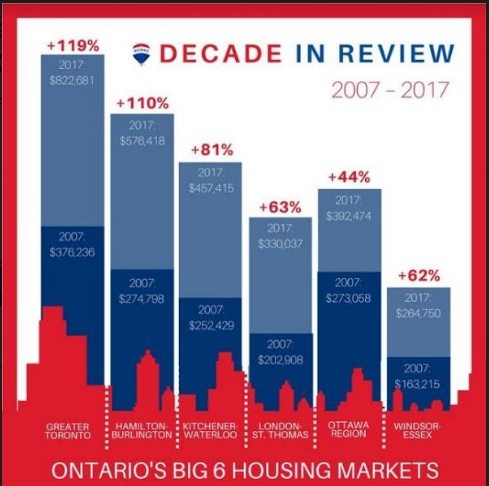
January 2018 Housing stats came in like a (FRIGHTENED) lion! But we expected that, right? After all, we are up against the highest sales and prices in TREB’s history when we look back at January 2107.
And what should we make of these stats?? Temporary Slump? Drubbing? Disaster? Crash landing? Major Correction?
That’s ONE way to look at it; however, ONLY if you’re not looking at job growth, increasing levels of full time employment, decreasing unemployment, rising annual net migration into the GTA, GDP growth and the MAMMOTH contribution the Real Estate industry contributes to the local economy.
For example, between 2014 and 2016:
- 142,000 jobs were created as a result of Real Estate transactions, adding $7 BILLION DOLLARS to the coffers. (professional services, renos, furniture purchases, moving costs, other household items)
- In new construction alone, 150,000 new jobs were created.
- $3BILLION DOLLARS were generated for the 3 levels of government ($1.6BILLION was Land Transfer Tax)
The government should be very cautious when it decides to “tamper” with the natural ebb and flow of the market, as its revenue AND job stream’s continued flows are at stake. Their focus should be on increasing the availability of land on which to build new housing, on decreasing the Land Transfer Tax to enhance affordability and encourage purchasers (over $68,000 in spin off expenditures is generated by each Real Estate transaction), on improving infrastructure and public transit options, and on increasing and building a more diverse housing stock….none of which they have done so far. They have still not addressed the ONE issue that is putting upward pressure on price, and that is to balance out SUPPLY with DEMAND.
Here are the quick facts on the stats:
*Sales were DOWN by 22% compared to last January
*New Listings were UP by 17.4% (but please note: this is still the 2nd lowest level of January supply in over a decade!!)
*Average sales prices shrank by 4% to $737K making affordability a little more accessible and especially after the introduction of the new “stress test”.
*Buyers are taking longer to step up in January 2018, both because they are exercising some welcome patience, but mostly because the supply of good homes to buy is so pathetically low. Last year average days on market were 19. This year….32 days! And this is DESPITE the fact that total inventory has swelled by 136%. BUT BEAR IN MIND….the supply levels in the city VERSUS the 905 area code are like night and day. So if you don’t mind moving outside the city core…well, you will likely find what you want at a much more digestible price.
*CONDO sales in January 2018 SANK by 20% but those average prices SOARED by 15% to $543K ..ouch!
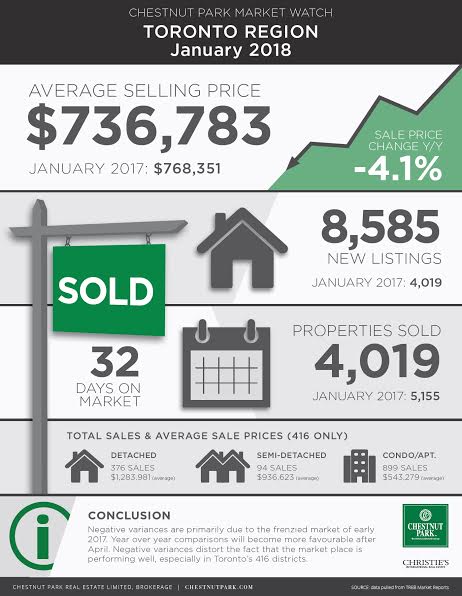
Here is a “snapshot” of what the city of Toronto looked like in January 2018. We extracted the data from 905 to show a clearer image of what is happening in the city and what lies ahead for Toronto’s home buyers and sellers. We think the first 4 months or so are going to repeat this trend of negative variances.
So, if you (or someone you know), are looking for a Realtor who cares MORE about focusing on you, your concerns, goals and the successful purchase or sale of YOUR unique home, than they care about their volume of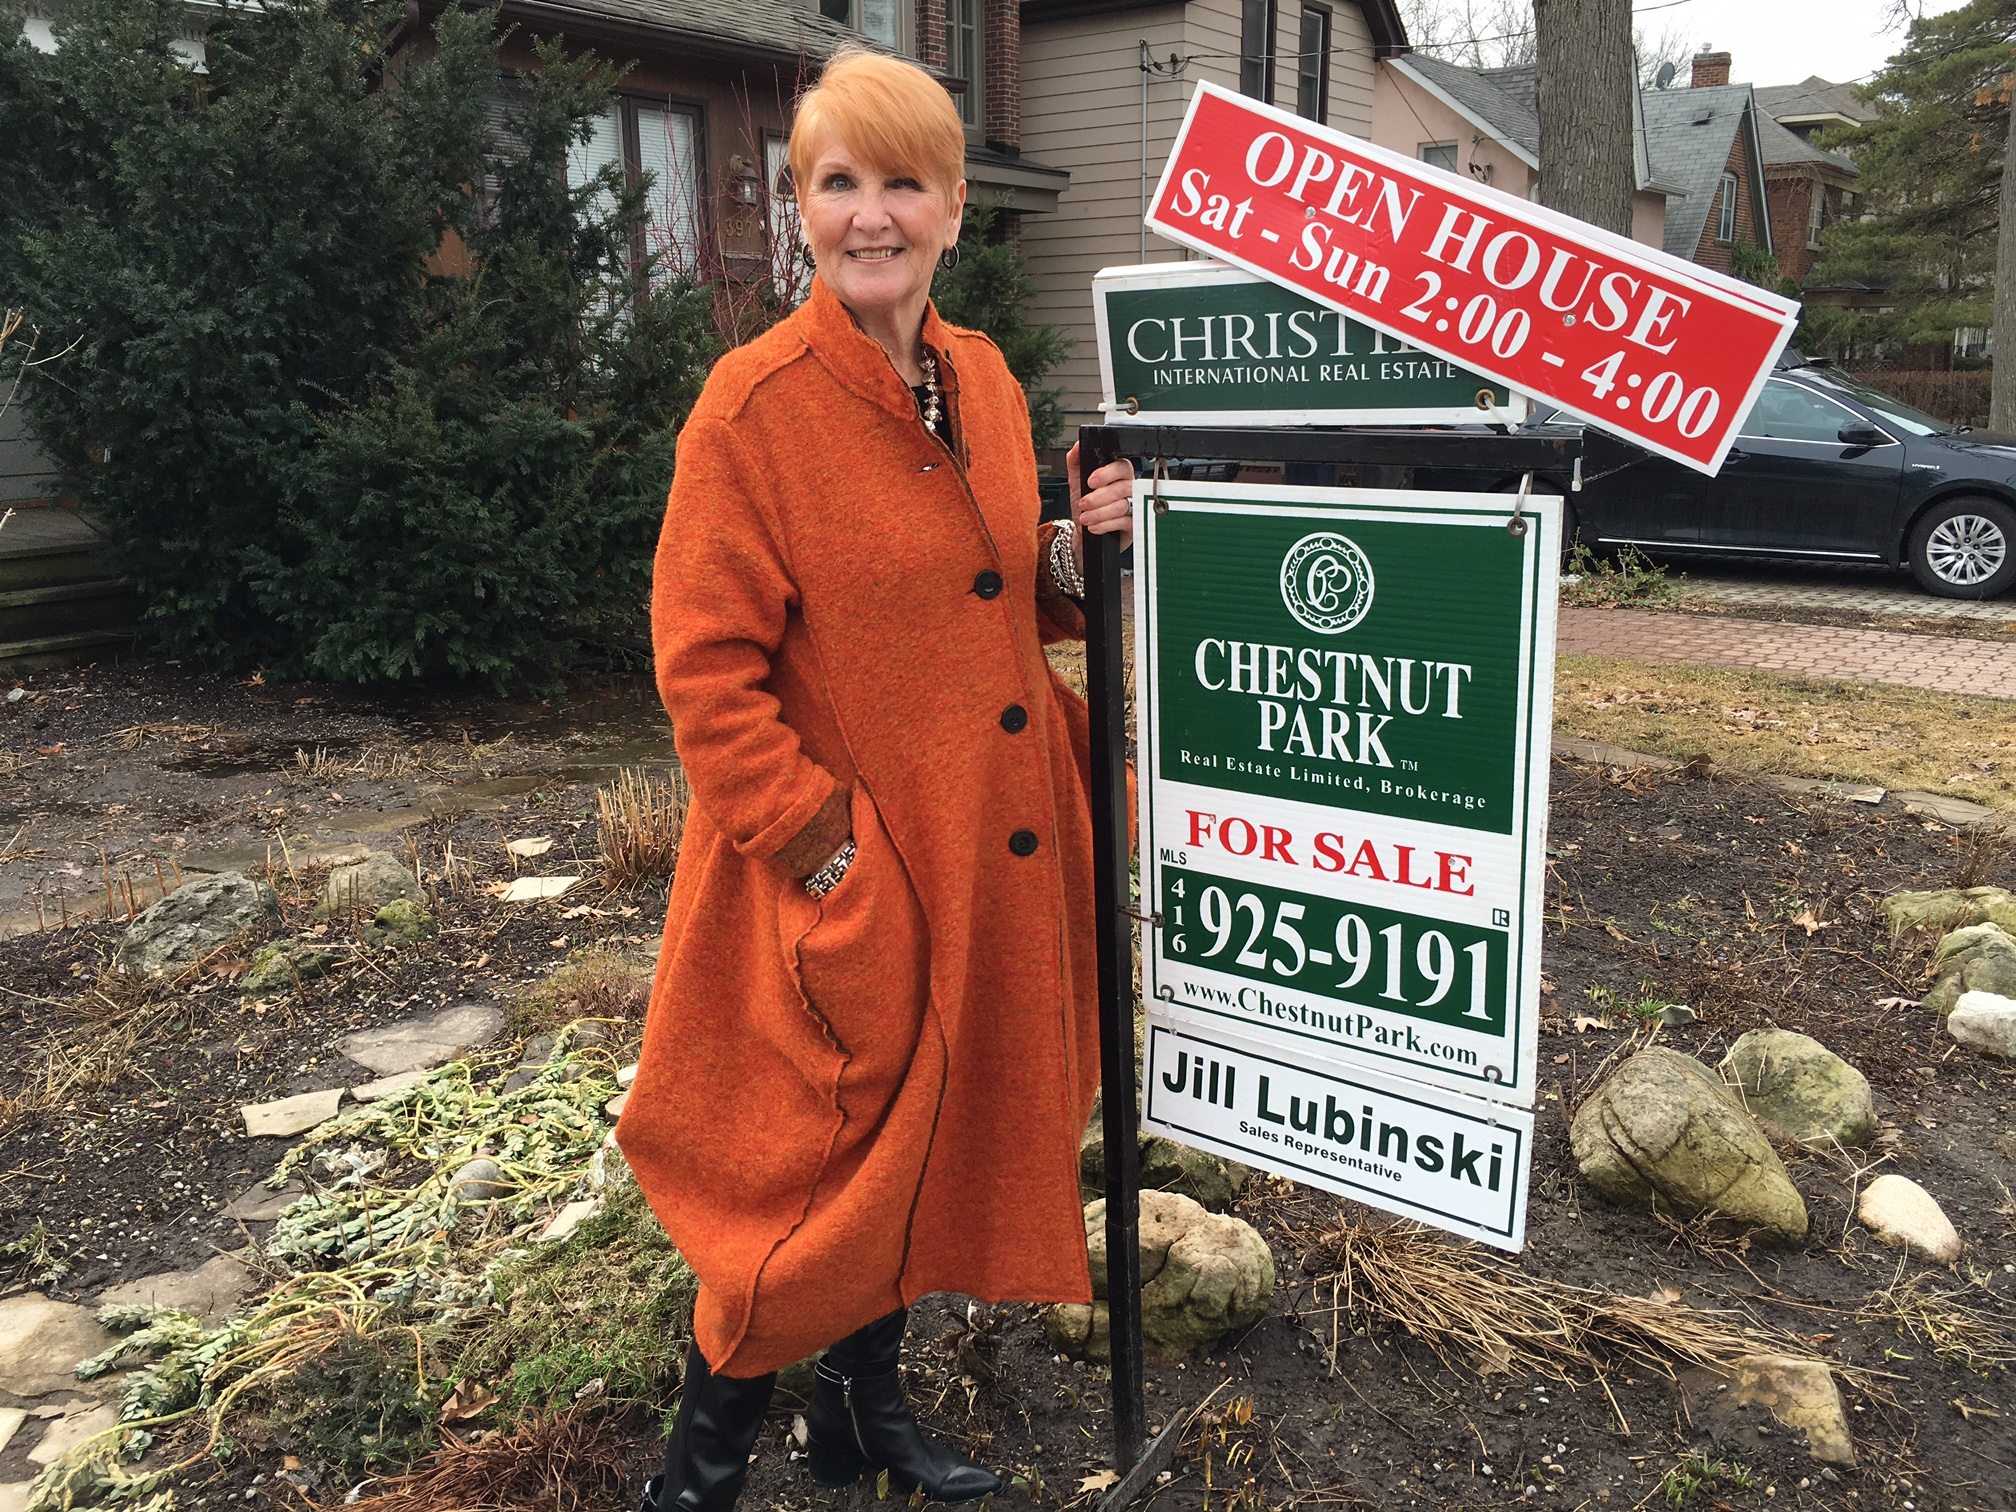 transactions and awards, please let me know the best way for me to connect. I would love to offer my highly personal service. Contrary to that old expression, not only IS this business, but it IS personal! And, please, I encourage you to ask me any questions you may have about this post. I value your input and appreciate the time you took to read it.