April 2018 Toronto housing stats are in. And the numbers are VERY significant!
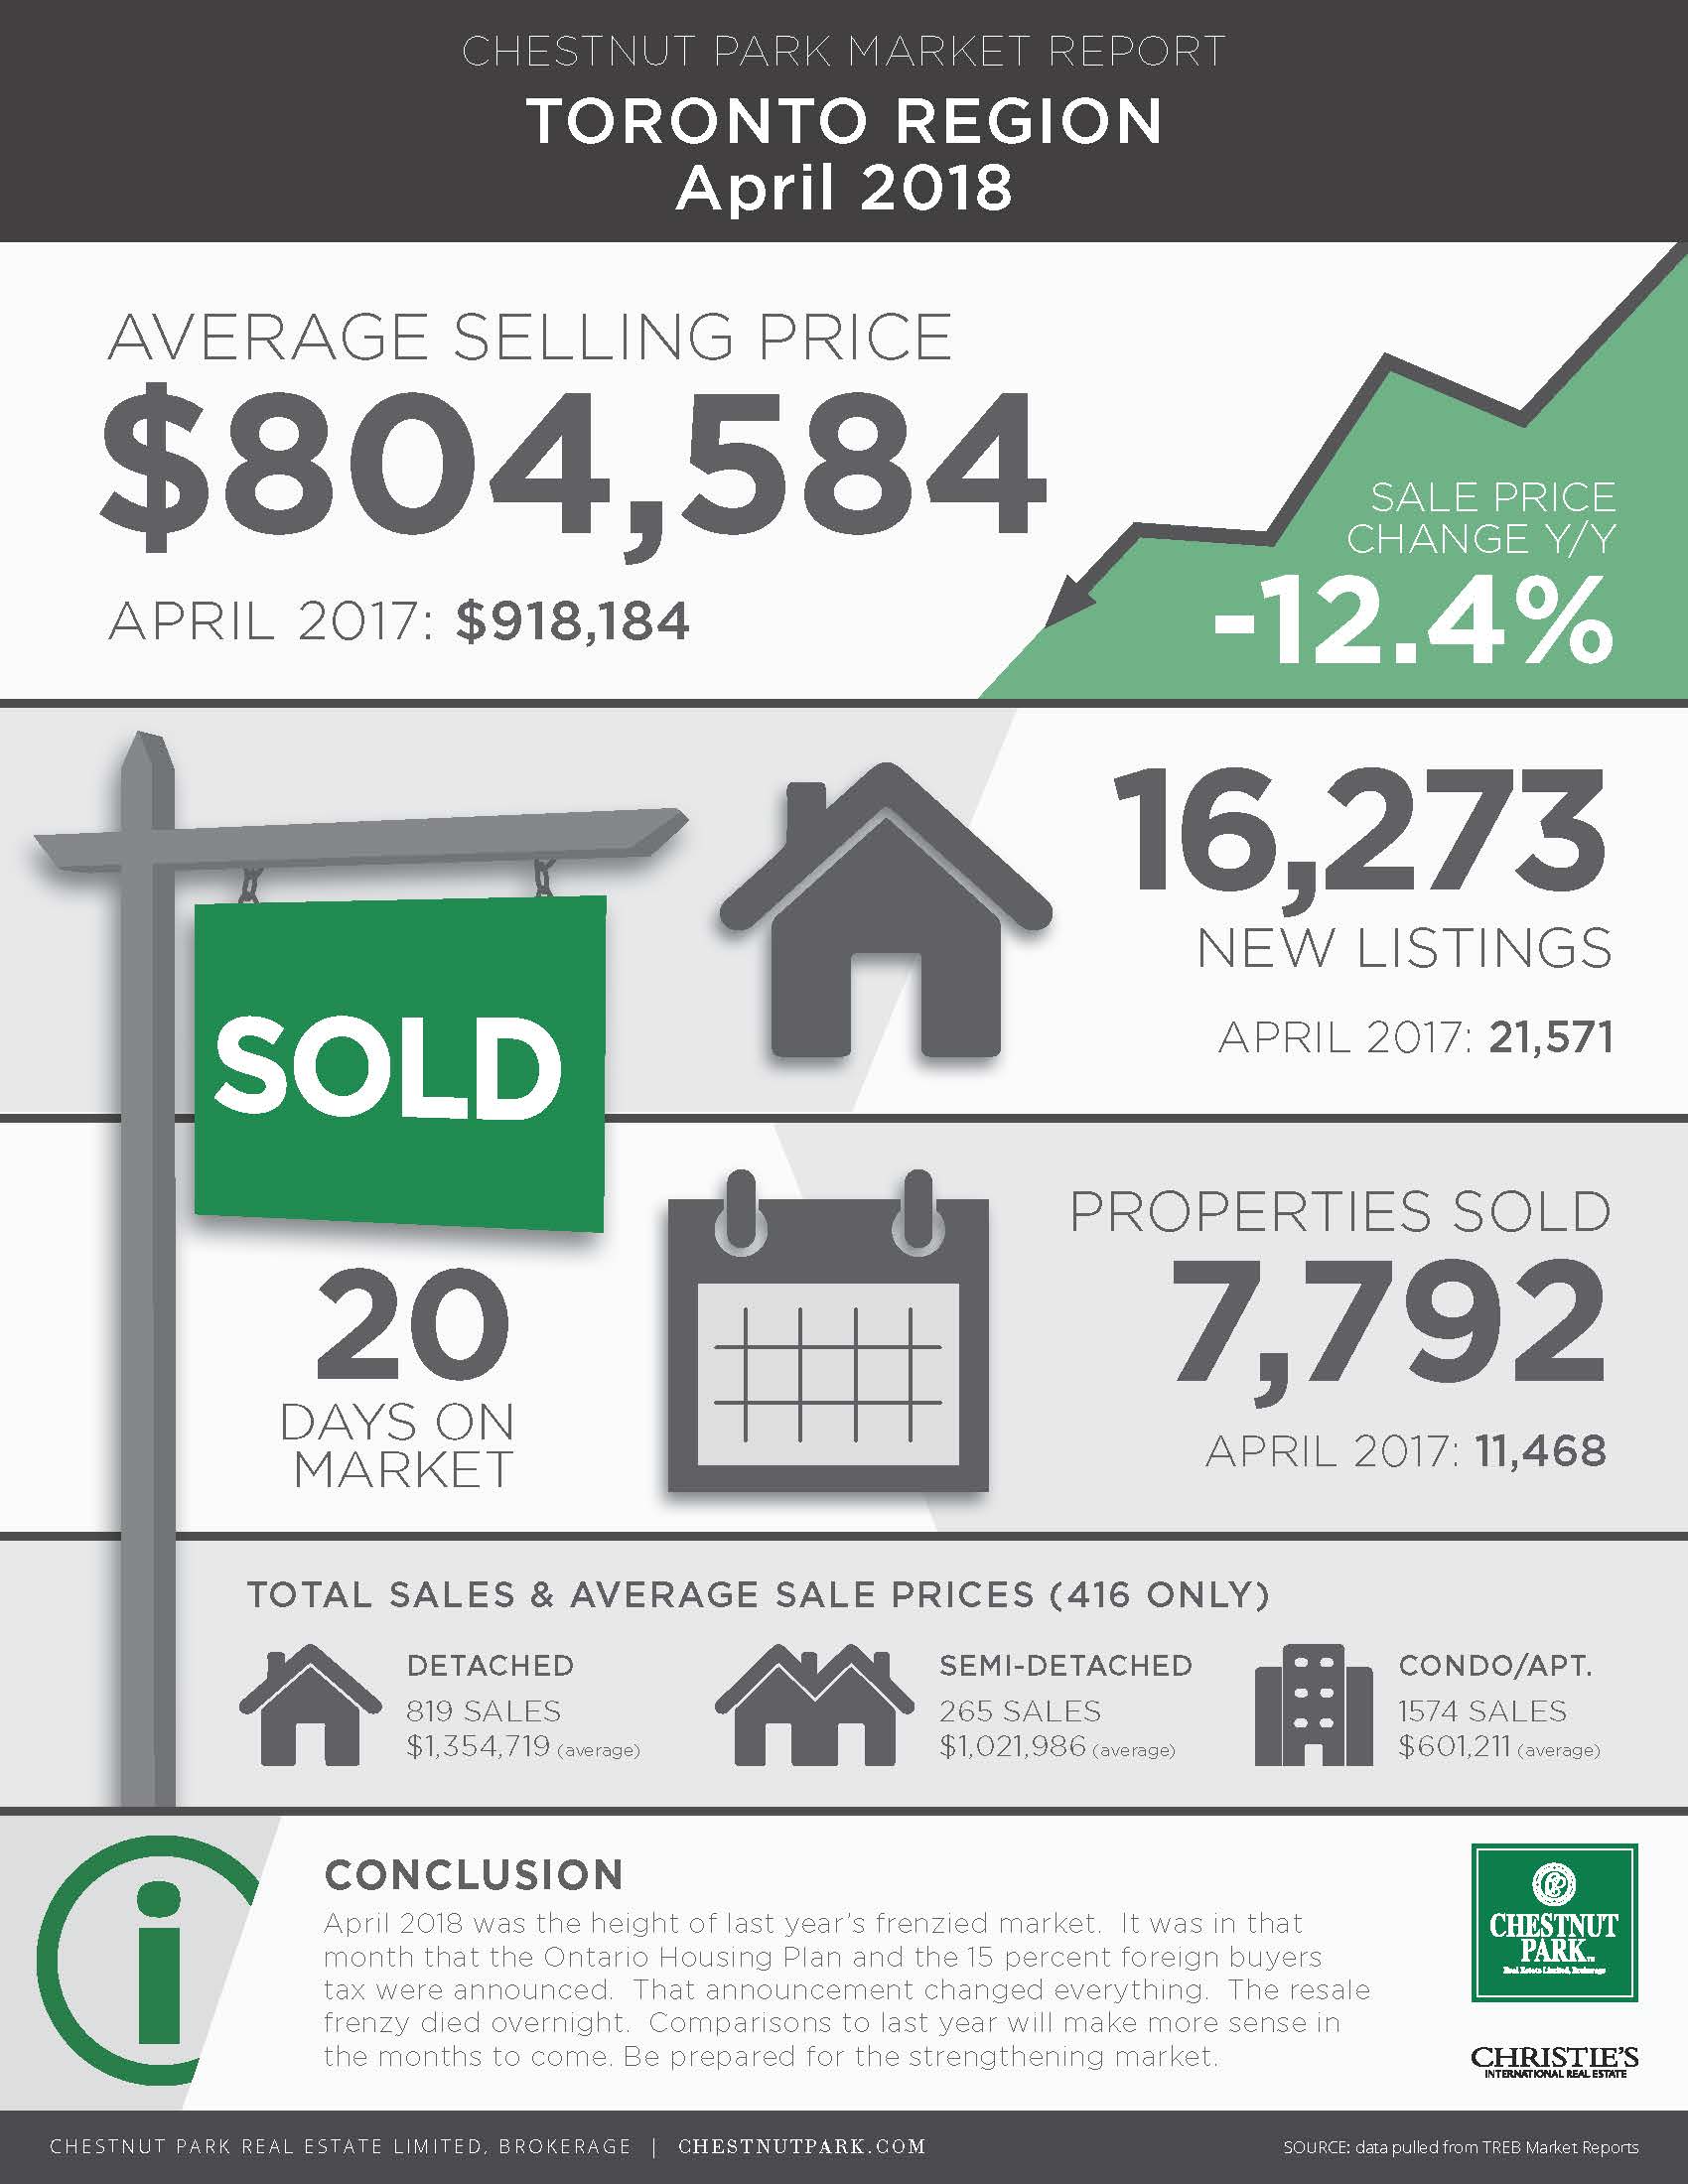 This infographic is showing the results for the CITY OF TORONTO as opposed to the GTA. There’s a reason for this…We still have a TALE OF 2 MARKETS and I thought it important to separate out the city’s results from the rest of the GTA.
When I start peeling back the layers, you will see, DESPITE the overall picture, that, not only are prices creeping up to match last year’s average, but also, that the city is ON FIRE in many districts.
Here are some of the crazy facts for April 2018:
*Sales down compared to April 2017 by 32% (not enough SUPPLY)
*Average prices down by 12% (more lower priced product is in the mix…ie Condos) AND sales of properties OVER $2ML DOWN by 71% compared to last April! Stripping out the variables, the BENCHMARK average price is only down by 5% though.
*New Listings down by 25%. Total listings are UP by 41% and are selling in 20 days (still very fast selling pace!!) on average….compared to WARP SPEED last year of NINE days!
*Condos average selling price SOARED to $601K …UP 4% vs. LY AND THE FIRST TIME BREAKING THE “6” BARRIER.
Here in the central core for April 2018:
*Average detached home costs over $2, 000,000
*Average semi runs at over $1,000,000 IF YOU CAN FIND ONE. Semi-detached inventory is IN CRISIS.
*Months of Inventory are at a low of 1.9 months…almost equal to April of last year and on average, sales are taking place at 102% of the asking price, and are selling in 16 days (including condos where status conditions take longer to go firm)
*Sales in midtown are out pacing the East end (Riverdale, East York and the Beach) for the first time in over a year. Sales in Roncy and the Kingsway are also outpacing the East end …very unusual. I suspect due to declining inventory in the East.
SIDEBAR:
The Vancouver market is in a state of STAGNATION due to gov’t intervention, new rates, new stress tests etc. They have had 3 rate hikes, new taxes on empty homes, new taxes on homes over $3ML, a new “speculation” tax to punish “flippers”….
BOTTOM LINE:
Gov’t legislation DOES NOT MAKE HOUSING MORE AFFORDABLE. Only more supply does that AND, the province is losing revenue due to the decline in sales and, by proxy, the decline in land transfer taxes to the provincial coffers. SALES ARE LOWER AND PRICES ARE NOT.
The same is true in Toronto, EXCEPT the Liberals have not instituted all those additional taxes on buyers…..yet! Please pray that they learn SOMETHING from the Vancouver market!
Last crazy fact:
The average sale price in the city for the first week of May 2018 was $893K
The average sale price in the city for the first week of May 2017 was $862K
So, YOU do the math! If you need help finding out what this all means for you specifically, just holler. I know I can bring some clarity to your Real Estate reality.
If you (or someone you know), are looking for a Realtor who cares MORE about focusing on your concerns, goals and the successful purchase or sale of YOUR unique home, than they care about their volume of transactions and awards, please let me know the best way for me to connect. I would love to offer my highly personal service. Contrary to that old expression, not only IS this business, but it IS personal! And, please, I encourage you to ask me any questions you may have about this post. I value your input and appreciate the time you took to read it.